Introduction to AWS-Managed Prometheus
This is a continuation from my AWS Twitch Stream on Observability with AWS-Managed Grafana, where I introduced AWS Grafana and how you can use it to improve your observability. So, if you haven’t watched that stream yet, watch it so you can follow along with this article.
Not too long ago, AWS expanded its monitoring and observability offerings to include some managed open-source tools: Prometheus & Grafana. I have provided an overview of AWS-Managed Grafana in my AWS Twitch Stream (linked above) and showed everyone how to deploy and set it up. Initially, I also planned to cover the basics of Amazon’s Managed Prometheus service, but had to cut it out to save on time. So, I have decided to refactor my slide content into a blog post that continues on from today’s stream.
In this guide, I’ll introduce you to Prometheus, how it works and how you can use Amazon-Managed Prometheus to monitor your resources and import them into Grafana to gain clarity over your environment.
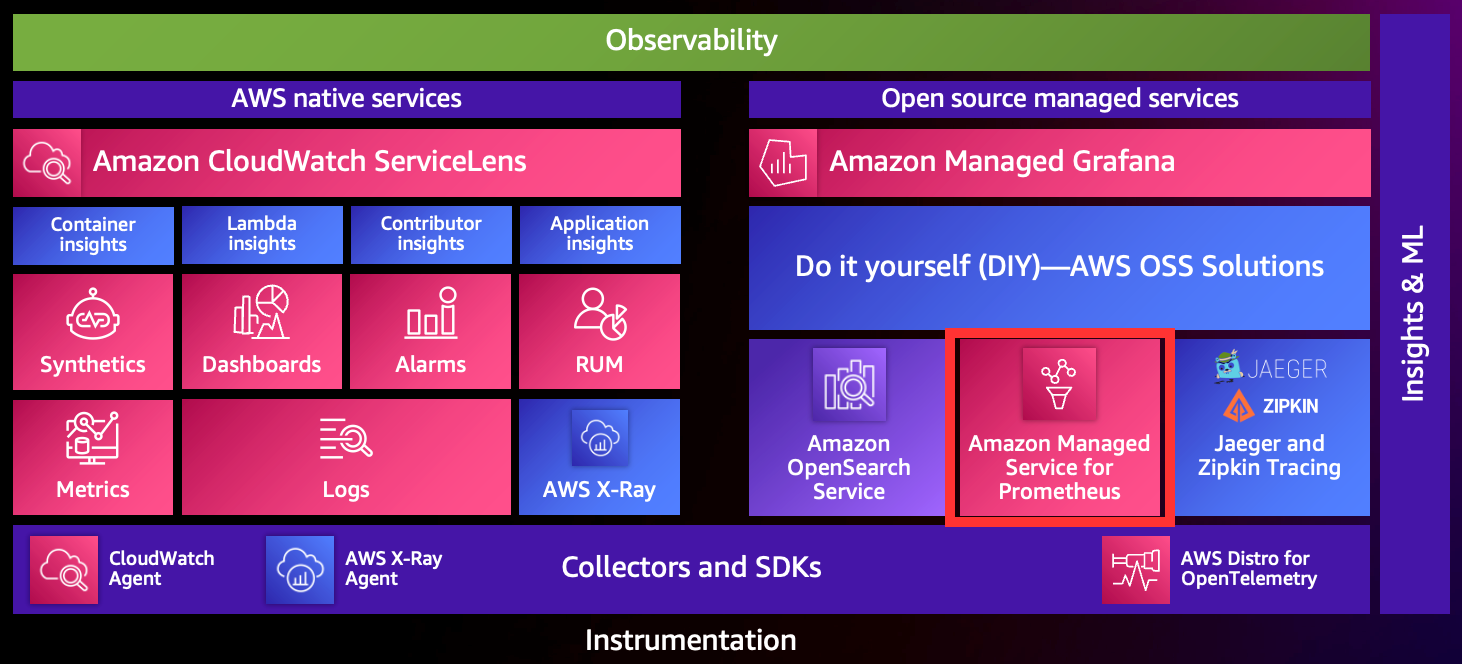 (image from AWS Observablity Workshop - https://catalog.workshops.aws/observability/en-US/intro)
If you’re interested in guides on installing Prometheus or configuring Amazon-Managed Prometheus on EKS or ECS, check out the bottom of this article, as I’ll add the references to documentation there.
A Short Introduction to Prometheus
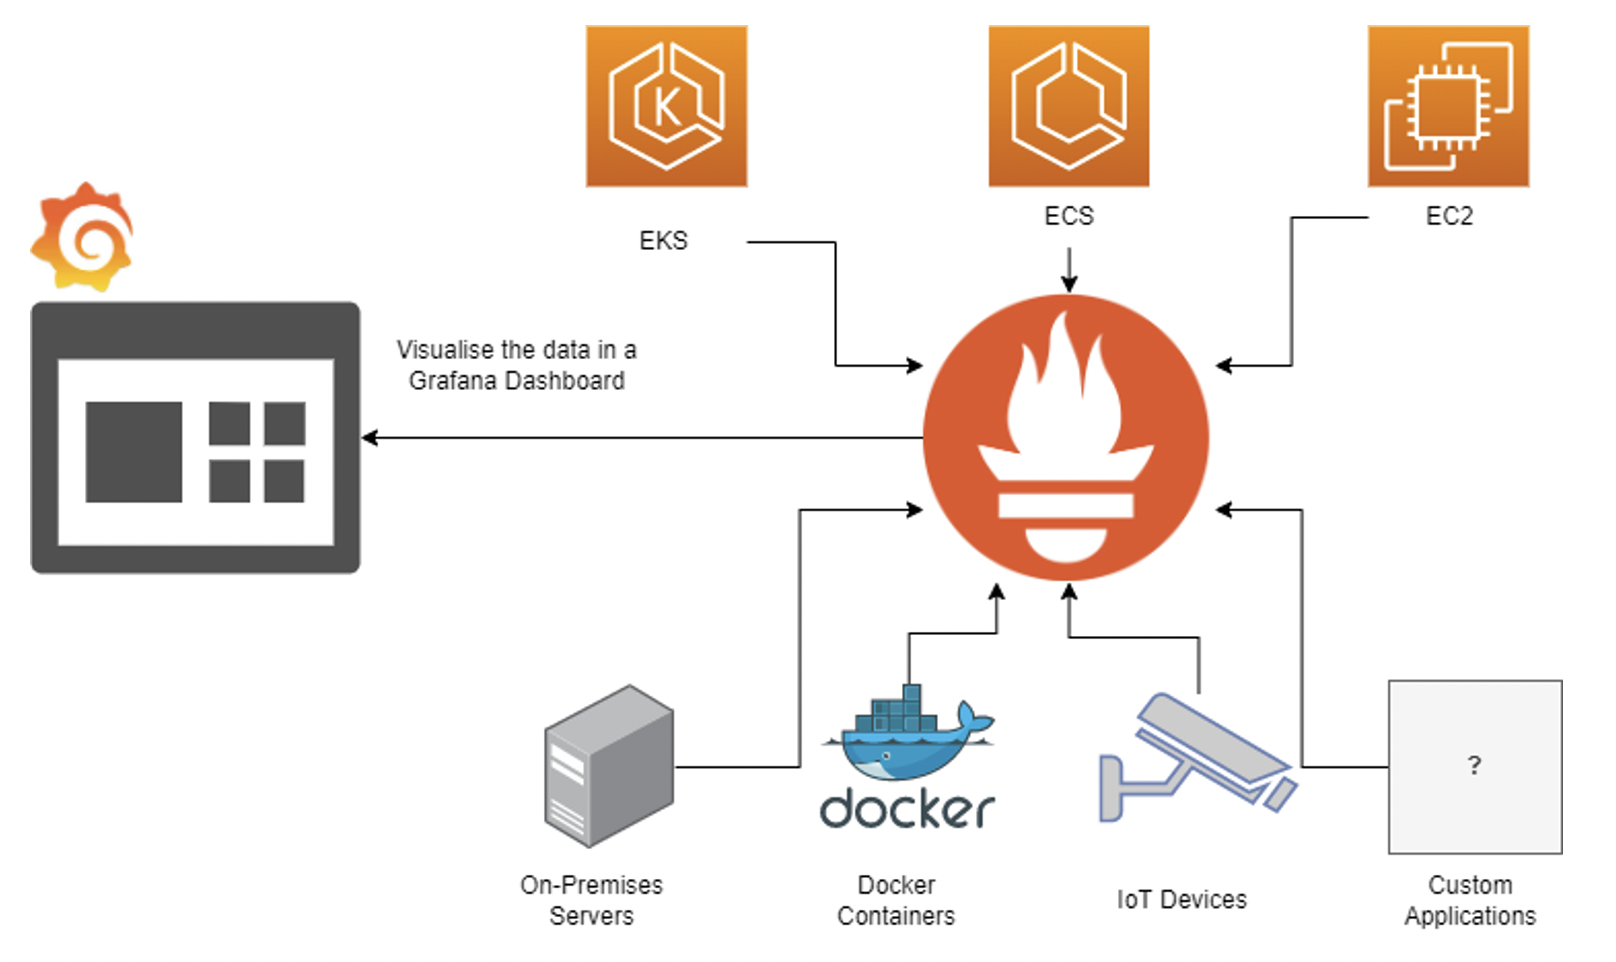
If you haven’t used Prometheus before but have heard of it, it’s a nifty tool that SoundCloud initially developed to monitor its infrastructure. It’s now a graduated Cloud Native Computing Foundation project. Prometheus, at it’s core, is a time-series database and is widely used by the DevOps community as a tool to monitor various systems and workloads. It can gather metrics from a variety of workloads ranging from IoT devices to traditional Windows and Linux workloads.
Due to Prometheus’s widespread usage and extension by the open-source community, it supports gathering and monitoring detailed metrics across a range of technology.
Prometheus can be overwhelming to deploy because to get the most out of it, a tool like Grafana must visualise that data. Furthermore, observing that data requires complex expressions to combine the granular Prometheus metrics into legible dashboards.
How Prometheus Works
The way Prometheus works is pretty simple. A Prometheus deployment will consist of at least two things:
- Metrics Exporter
- Prometheus Server
These components are pretty self-explanatory. The metrics exporters are the data-gathering piece; they gather metric data such as free memory, disk space, etc., and they export it via an HTTP endpoint. It’s that simple; it’s just a web page, and you can even curl it.
But how does Prometheus get those metrics? In a couple of ways:
- Scraping
- remote_write
I’ll describe these and their differences below:
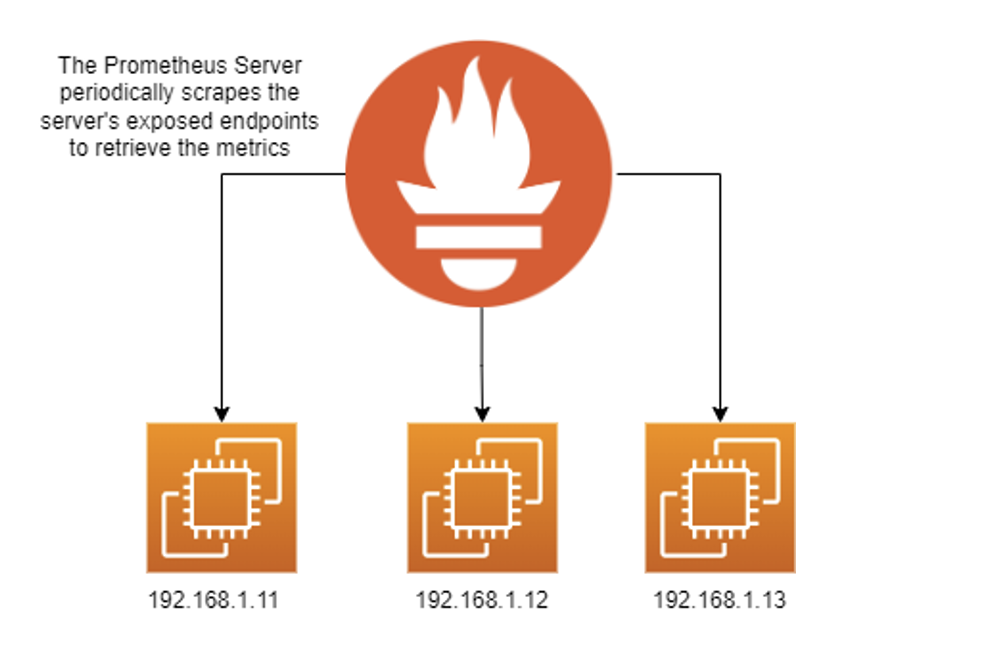
Scraping
Scraping is the ‘traditional’ Prometheus approach. When configured to scrape, the Prometheus server periodically scrapes these HTTP endpoints, which the exporters expose; they contain the metrics the exporter gathers. In this way, Prometheus pulls the data as opposed to the nodes sending the data to the server.
Configuring Prometheus to scrape works well, but there are a couple of drawbacks:
- Horizontal scaling, if implemented poorly, can lead to duplicate metrics.
- Dynamically telling Prometheus what endpoints to scrape.
You can also implement discovery with Prometheus; for example - you can authenticate with EC2, and Prometheus will dynamically add or remove nodes to scrape. You can even filter it by tags, making it a dynamic solution where you can add or remove resource tags.
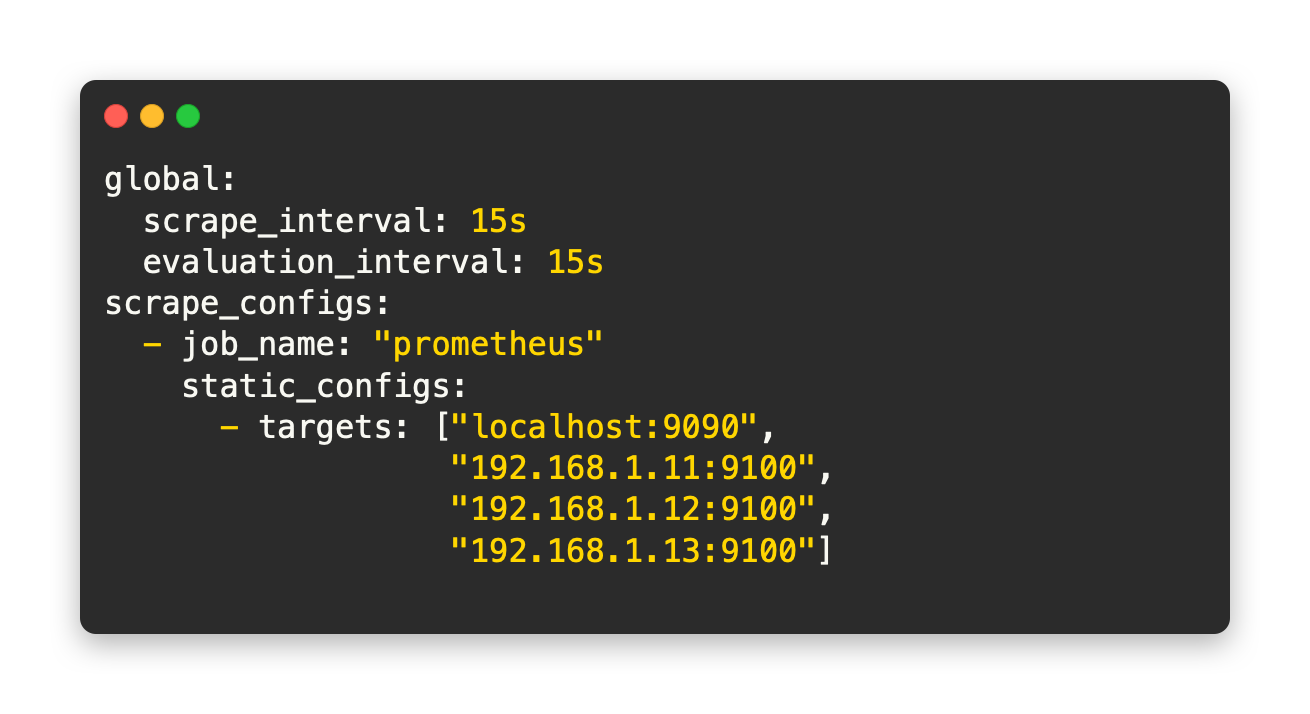
If you’d like to use the scraping approach - here’s an example of what a configuration file would look like:
Remote Write
Remote write is a recent approach to Prometheus and can be used to deploy Prometheus in an agent-like manner. For example, instead of exposing metrics to Prometheus, we don’t expose it and instead scrape it internally on a locally installed Prometheus server (don’t worry, they’re lightweight). Then the Prometheus server will write those metrics it scrapes to a remote Prometheus server.
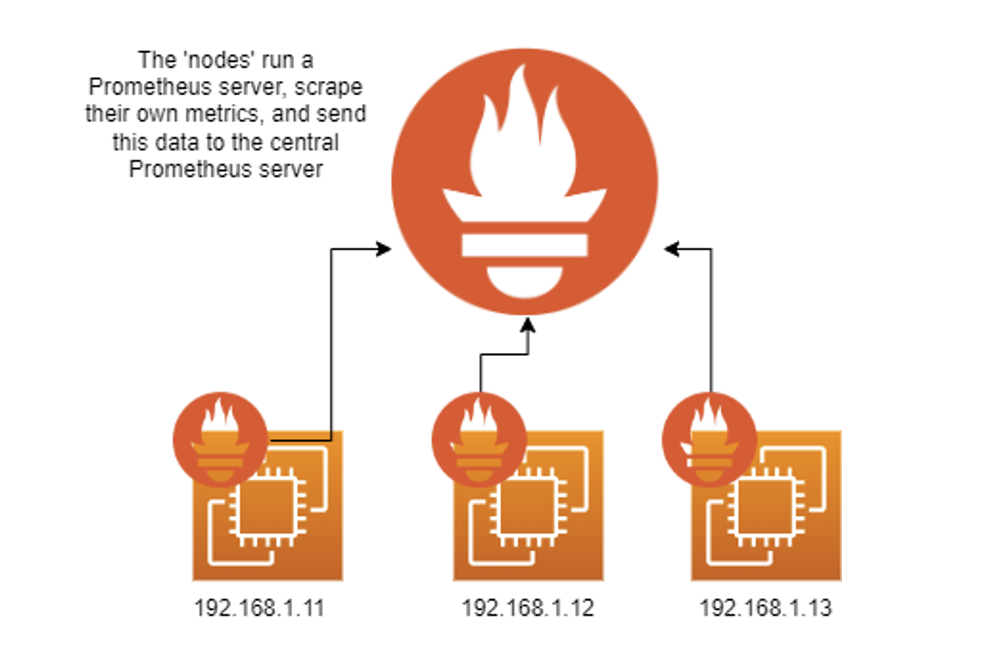
Using remote_write instead of scraping can significantly simplify our Prometheus deployment, especially if we have a dynamic infrastructure with resources being created and terminated as needed since you can configure Prometheus by pushing the same configuration file to each instance.
So, what’s an example of configuring remote_write?
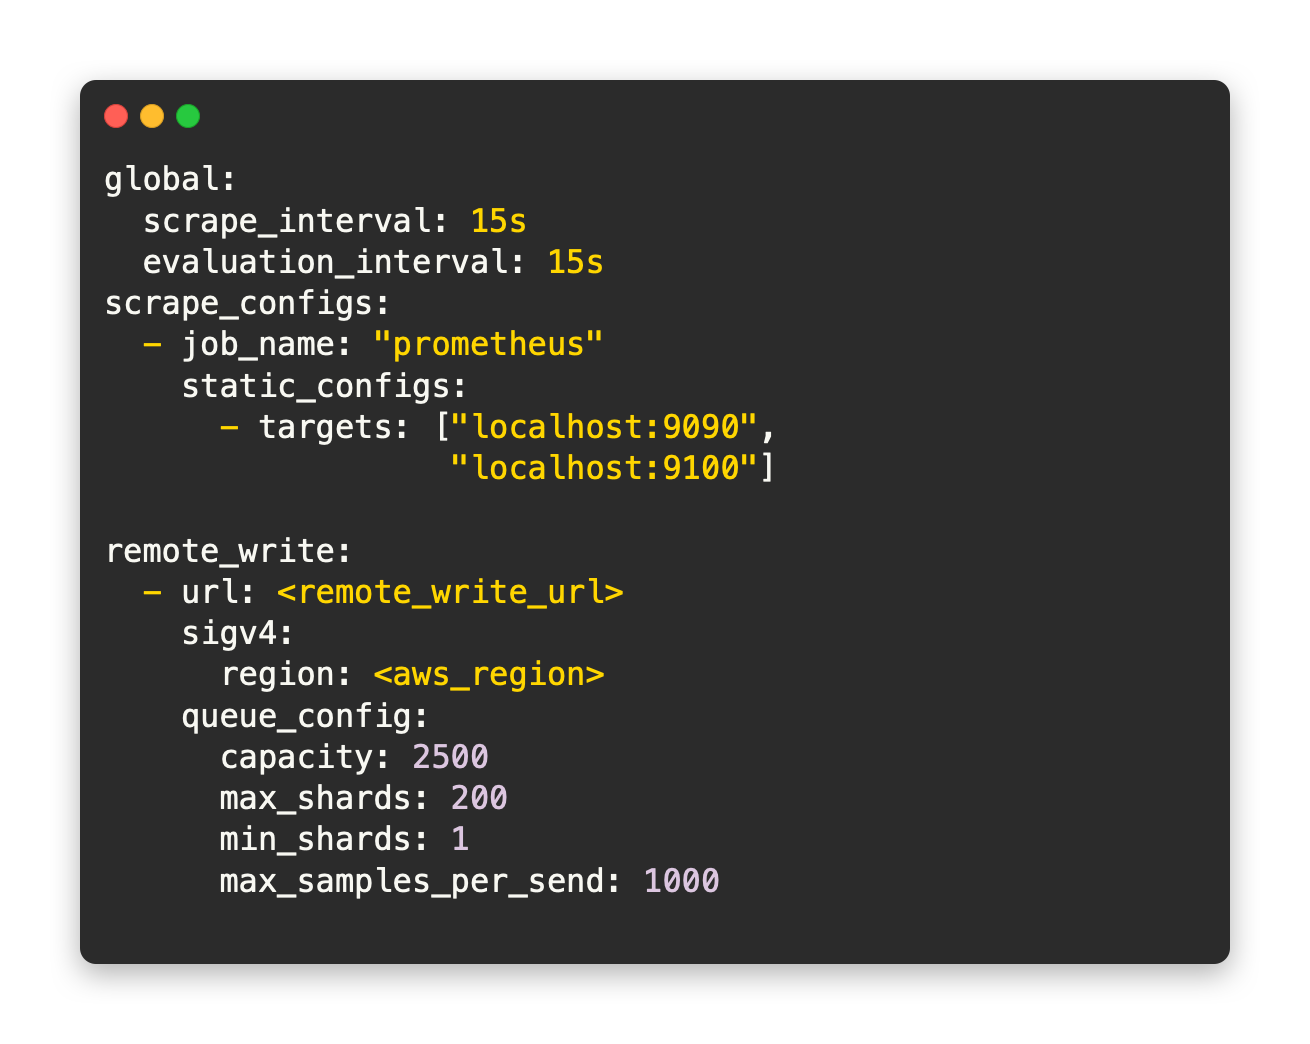
You should be able to use this snippet for later use if you want to configure your Prometheus server to remote_write to AWS-Managed Prometheus.
Introducing AWS-Managed Prometheus
So, we’ve just been over Prometheus, how we can use it and the different ways we can configure it. Now, let’s dive into AMP (Amazon-Managed Prometheus).
AWS Managed Prometheus is straightforward to use and fully manages it’s data storage; it doesn’t give you a configuration file to edit and is merely a remote_write endpoint. On the other hand, it provides the capability of setting up complex rules to combine metrics and gives you access to AlertManager.
Let’s compare the service to the open-source version we’d deploy ourselves.

Amazon-Managed Prometheus
Let’s take a look at what AWS-Managed Prometheus can bring us:
Hosted by AWS
AWS hosting AMP is pretty apparent, but something to note is that the service is configured to auto-scale and upgrade for you automatically! In addition, there is no infrastructure to manage; notably, AWS hosts it across 3 AZs.
150-day Retention
The retention period for metrics in AWS-Managed Prometheus is hard-locked at 150 days. Afterwards, AMP will delete them.
IAM Roles
Like AWS-Managed Grafana, this is reason enough to use this service over open-source Prometheus for simplicity alone. In addition, you are free from managing a separate set of credentials on your central Prometheus instance that stores all your data.
AlertManager Integrates with SNS
Integrating AlertManager and SNS makes alerting easy if you are already monitoring workloads in AWS. Use the same SNS topics you have set up to send messages to your team and use it for AlertManager.
Remote Write Only
The only option we can use to get metrics to Amazon-Managed Prometheus is remote_write. It will work for all of our use cases, even if we require scraping for specific deployments, as we can set up a Prometheus server in front of AMP to perform any scraping for us.
Open-Source Prometheus
Let’s compare AMP to deploying Prometheus ourselves:
Self-Managed
We can still host Prometheus on AWS, although we need to manage it. The best ways to host open-source Prometheus are EKS and ECS for scalability and ease of deployment. Still, it will be up to you to configure Prometheus for both high availability and scalability, regardless of your approach.
You need to manage the data store
When you deploy Prometheus yourself, you need to store the data. You could write the data to a central Prometheus instance, or perhaps you’ll want to configure just some centralised persistent storage for all of your instances.
Managing the data storage yourself adds complexity and technical debt as you need to ensure reliability, durability and availability, and you must secure it with encryption.
Security is up to you
Deploying Prometheus yourself also means you’re in charge of Security. For example, you’ll need to upgrade your Prometheus instances and ensure you’re using the latest features and avoiding vulnerabilities. In addition, if you plan to authenticate to AWS, you may need to use access keys.
AlertManager does not integrate with SNS
AlertManager is pretty versatile, so you’ll be able to configure it with a communication medium that suits your needs even if you host Prometheus yourself. Still, it will add technical debt and complexity since you won’t be integrating into your well-known and centrally managed AWS services.
Supports Scraping and Remote Write
If you choose to host Prometheus yourself, you can utilise scraping and remote writing.
Deploying AMP
Deploying AMP is pretty straightforward; there are only three steps.
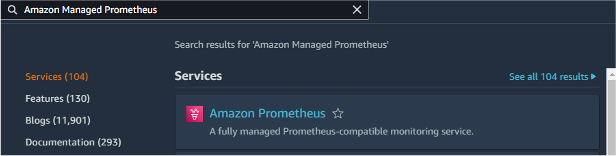
Navigate to Amazon Prometheus in the AWS Console
Click ‘Create’
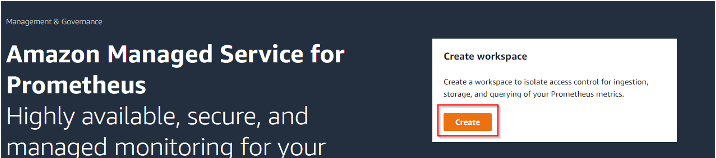
Enter your workspace alias and any tags (recommended)
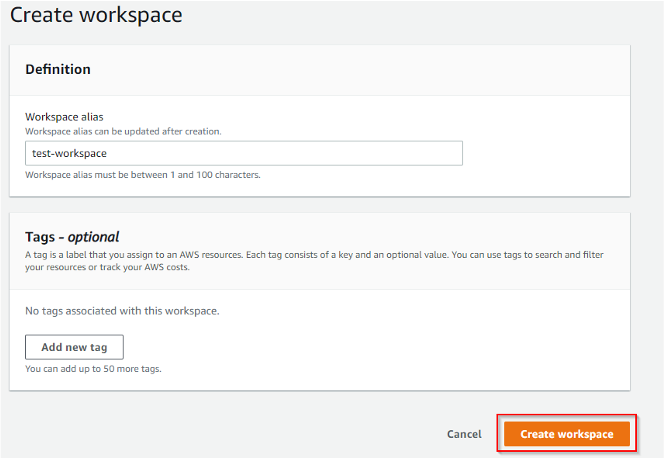
Click ‘Create workspace’
Once you’ve clicked Create Workspace, you’ll have to wait a bit, but eventually, you’ll see a screen that looks like so:
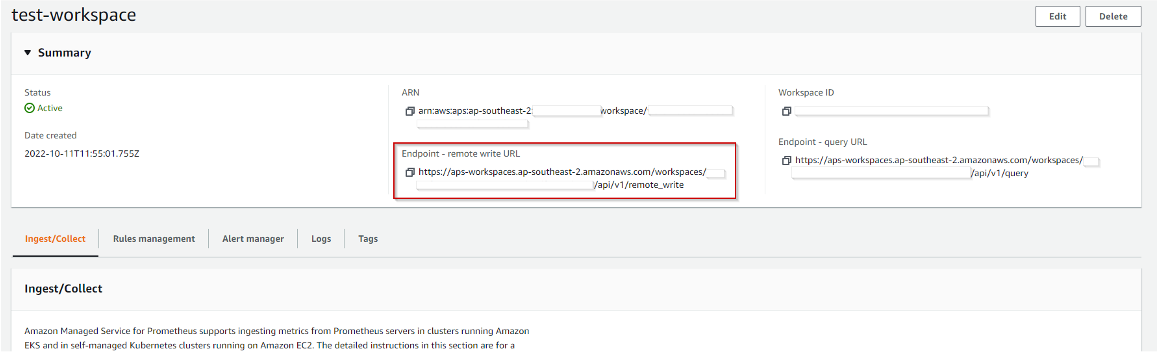
The critical thing to remember here is the remote write URL. That is the URL where we will write our data.
Usage Options
I have listed some options that will provide a starting point for determining how you’d like to deploy AMP in your environment.
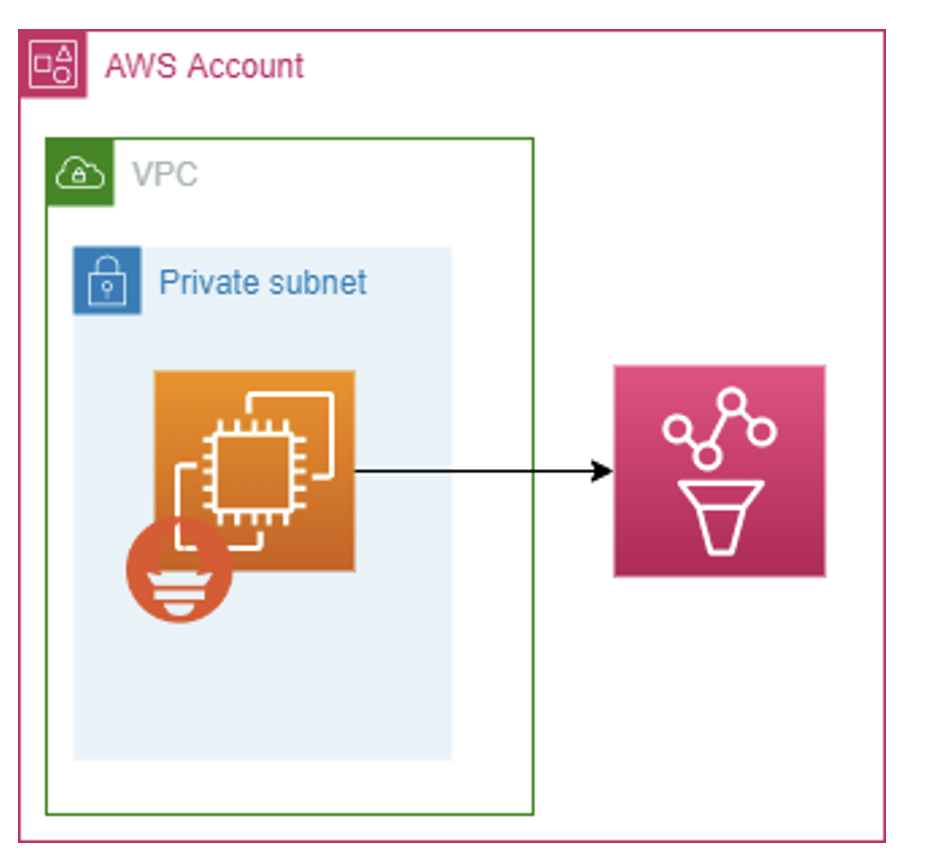
You can write directly to AMP using remote_write, which I’d consider the most straightforward approach. If you’re using Prometheus to monitor any traditional-style workloads on EC2 instances, this is most likely the approach you’ll use.
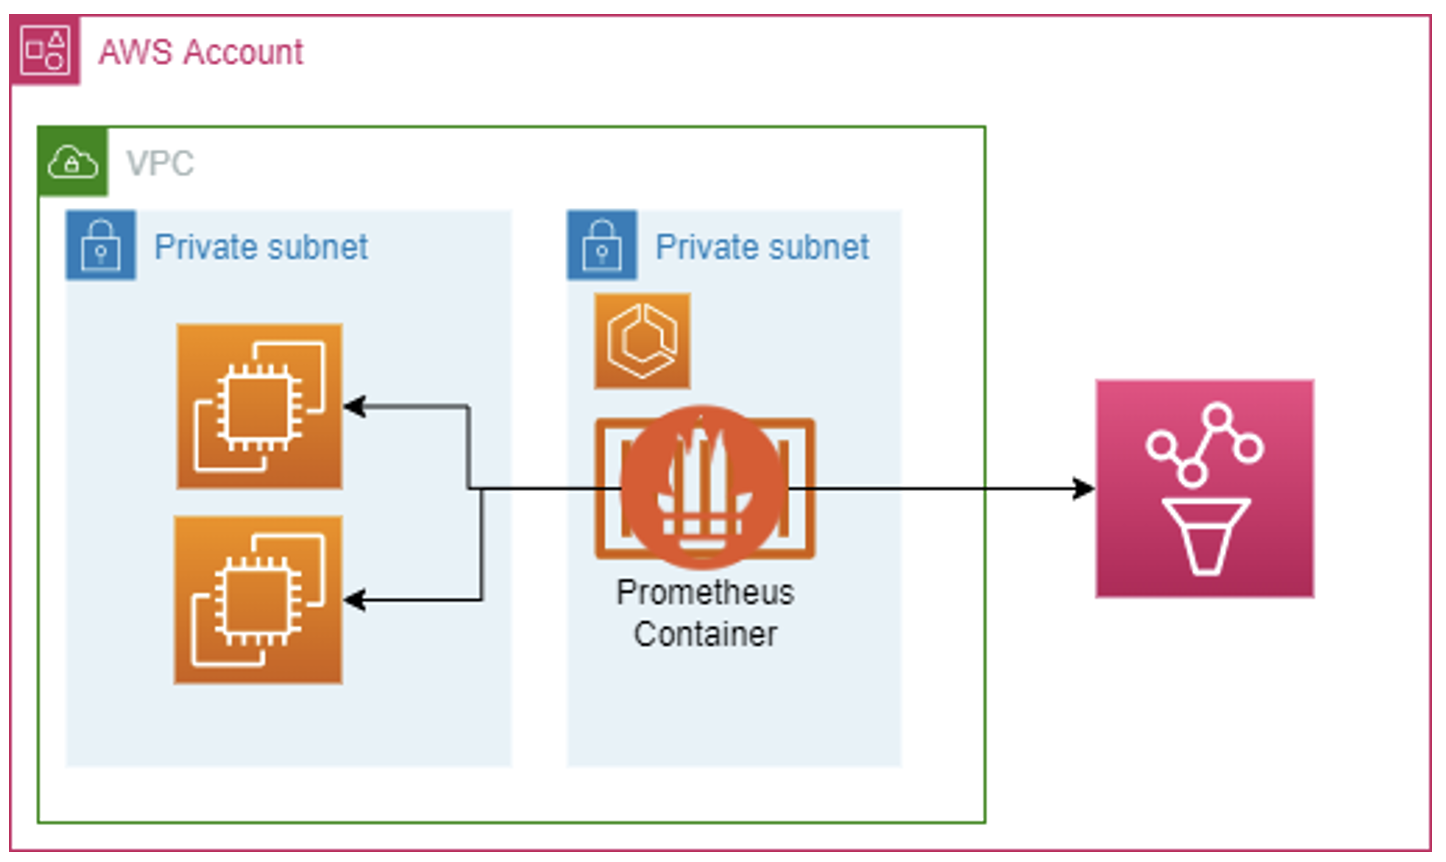
You can also put a Prometheus server in front of AMP that can scrape any nodes that don’t support remote_write, or perhaps you’re using something like Kubernetes where you already have Prometheus configured. In that case, you can remote_write from your current Prometheus instance to AMP and use it as the metric store.
Integrating AMP with AWS-Managed Grafana
Observing your AMP data from AWS-Managed Grafana is straightforward. We can follow the process I used during the Twitch Presentation by navigating to AWS > DataSources, selecting the Amazon Prometheus Service, and importing the metrics from your workspace.
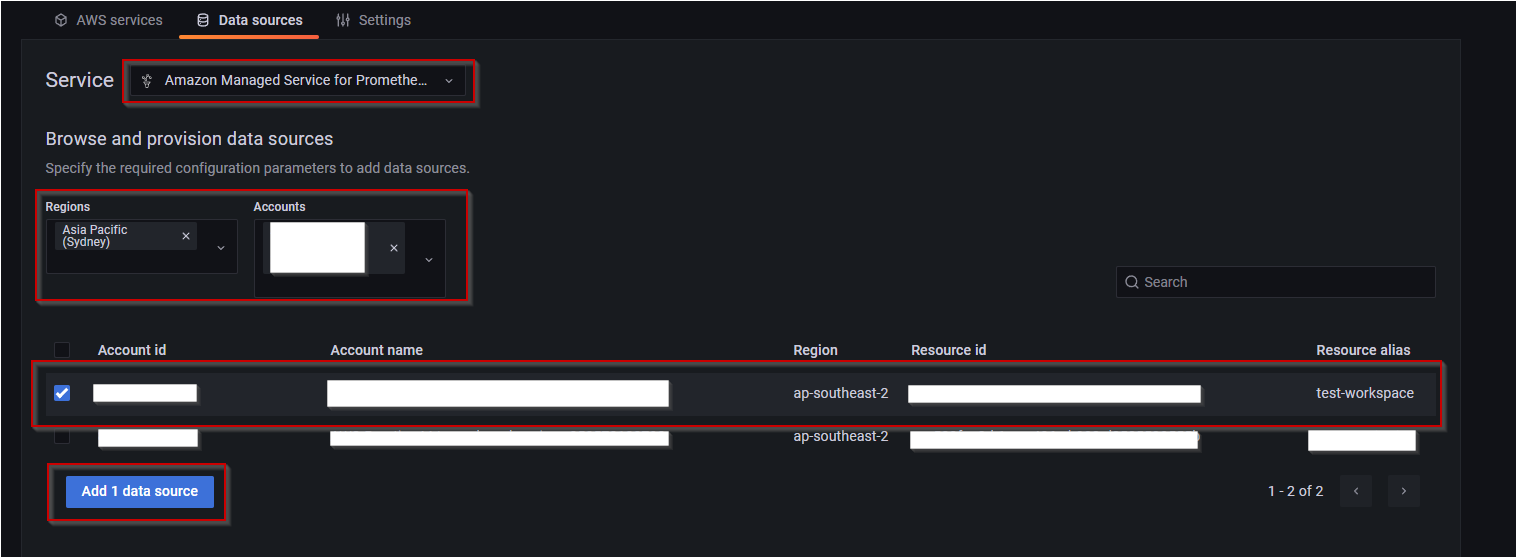
Once you’ve added AMP as a data source, you can start using Prometheus dashboards; Grafana sees the metrics as any other Prometheus data source, meaning any Prometheus dashboards you import will work out of the box.
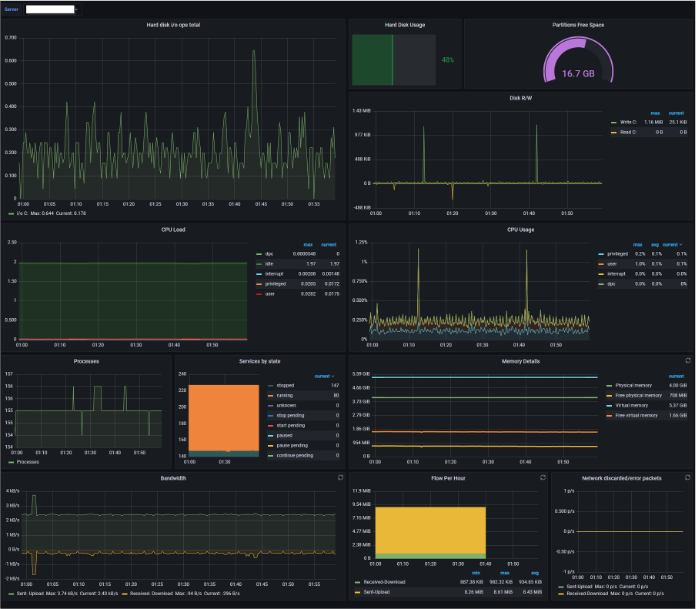
Here’s an example of using AMP to observe my Windows instance in Grafana:
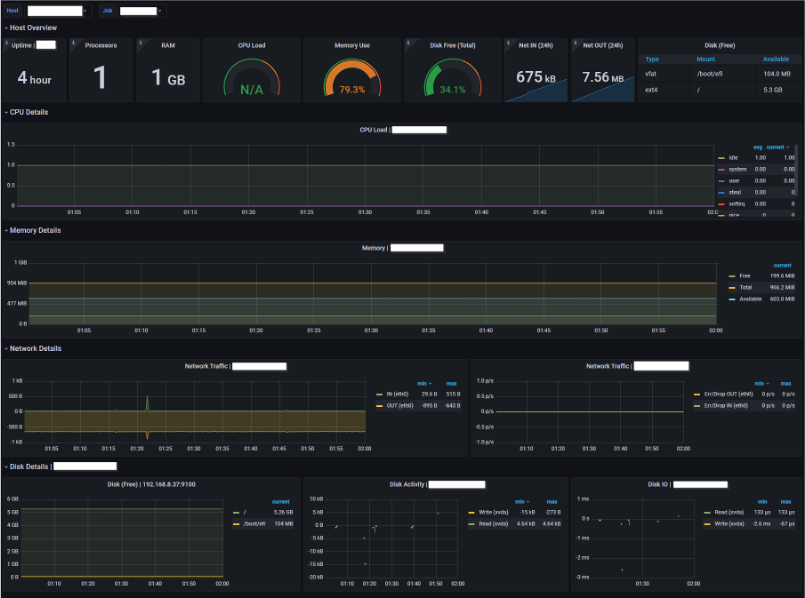
I also used the imported AMP metrics to create a dashboard to monitor my Linux instance:
I hope the post has given you some insight into Amazon Managed Prometheus, how it works, how to deploy it and when you might want to use it.
The point of this post isn’t to turn you into a Prometheus or AMP expert but to show you what the service is capable of and hopefully inspire some internal discussions and thoughts about whether AMP is a tool your team could utilise.
Additional Resources:
As promised, here are some resources that you might find very helpful:
Alternate Approaches
Here is a list of articles on how to import Prometheus metrics straight into CloudWatch. This might be easier for you if you use CloudWatch for everything already, or only have a small/niche deployment of Prometheus.
Importing Prometheus Metrics using CloudWatch Agent on EC2 (alternate approach) https://docs.amazonaws.cn/en_us/AmazonCloudWatch/latest/monitoring/CloudWatch-Agent-PrometheusEC2.html
Importing Prometheus Metrics using CloudWatch Agent on EKS and Kubernetes Clusters https://docs.aws.amazon.com/AmazonCloudWatch/latest/monitoring/ContainerInsights-Prometheus-Setup.html
Prometheus Documentation
This section covers some links to the Prometheus Documentation that will help you to install and configure Prometheus.
Getting Started - Prometheus https://prometheus.io/docs/prometheus/latest/getting_started/
Security - Prometheus https://prometheus.io/docs/operating/security/
Alerting (AlertManager) - Prometheus https://prometheus.io/docs/alerting/latest/overview/
Recording Rules - Prometheus https://prometheus.io/docs/practices/rules/
Prometheus Agent Mode https://prometheus.io/blog/2021/11/16/agent/
Amazon-Managed Prometheus Documentation
These articles go over ingestion methods for AMP. AWS has put together a lot of good examples for configuring AMP to monitor EKS, EC2, ECS, etc. so it’s worthwhile checking the articles out before you deploy it in your environment.
Recording and Alerting rules, Security, and AlertManager documentation for AMP will help you understand all the configuration options you have for AMP. It’s recommended to read-through the Prometheus documentation above before reading through this if you are new to Prometheus, as it will give you an overview of the technology.
AMP Ingestion Methods https://docs.aws.amazon.com/prometheus/latest/userguide/AMP-ingest-methods.html
Recording and Alerting Rules https://docs.aws.amazon.com/prometheus/latest/userguide/AMP-Ruler.html
AMP Security https://docs.aws.amazon.com/prometheus/latest/userguide/security.html
AlertManager https://docs.aws.amazon.com/prometheus/latest/userguide/AMP-alert-manager.html