
This is a continuation of my Twitch Stream on Observability with Grafana, where I introduced AWS Grafana and how you can use it to improve your system’s observability. So, if you haven’t watched that yet, watch it so you can follow along here.
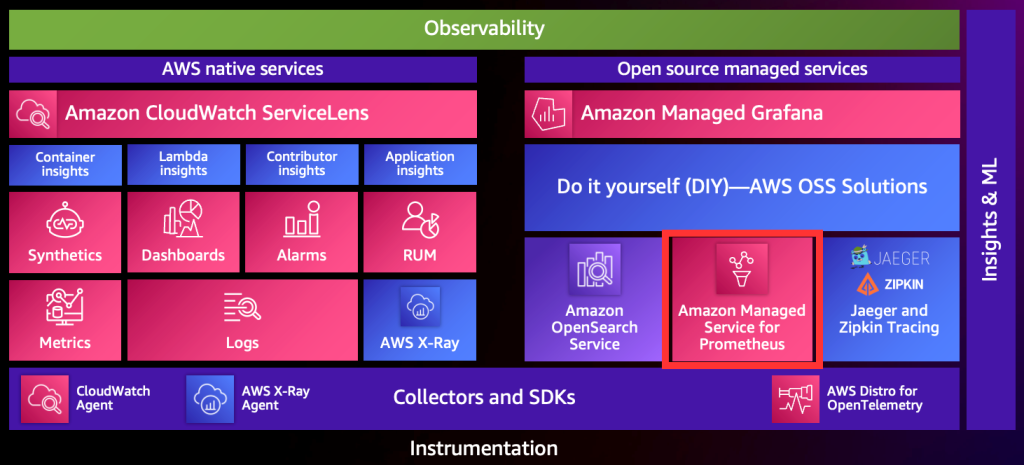
Not too long ago, AWS extended it’s monitoring and observability offerings to include some open-source tools bundled as managed services: Prometheus and Grafana. I have provided an overview of AWS Grafana in my AWS Twitch Stream and showed how to deploy and configure it. Initially, I also planned to cover the basics of the AWS Prometheus service, but had to cut it to save on time.
So, I have decided to add the additional content here in the form of a blog post.
Prometheus, at it’s core, is a time-series database that’s widely used by engineers to store metrics (and can also store logs, but that’s another story!). You can use configure Prometheus in various ways, but the result is always the same, gathering and indexing metrics about your systems so they can be visualised in a dashboard (like Grafana) or alerted on.
How it works
Traditionally, a Prometheus deployment will consist of a couple of components:
- Metrics exporter – a simple web-server that exposes a series of metrics that can be scraped.
- Prometheus Server – scrapes endpoints (metrics exporters) for metrics and stores and indexes them in a database.
Nowadays though, Prometheus also supports an agent mode, using remote write, which allows you to, well, as the name suggests, remotely write metrics to a Prometheus server instead of the server scraping your endpoints. This is handy because in many environments, we don’t want to be exposing HTTP endpoints, or perhaps we just can’t.
The metrics Prometheus gathers could be anything, and you can organise these metrics using labels, which you can use to query your metrics more effectively in the time series database. Both scraping and remote write modes support using labels.
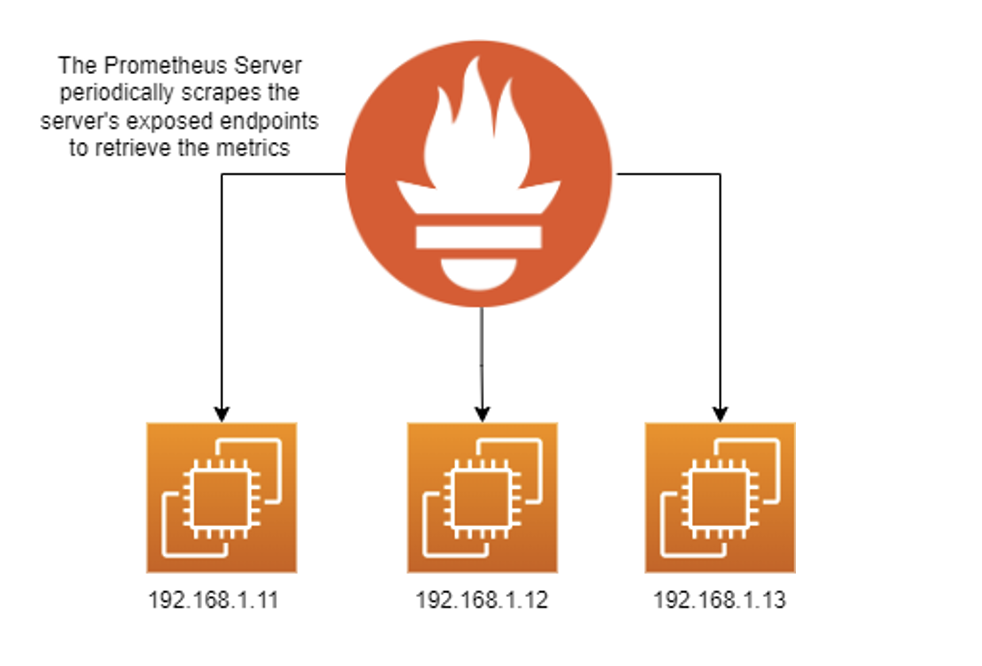
Scraping
Scraping is the tried and true, traditional approach to gathering metrics. When configured to scrape, your Prometheus server will occasionally scrape the HTTP endpoints configured in your Prometheus server’s configuration file. Your endpoints can be configured with various types of authentication, meaning they don’t have to be unauthenticated endpoints.
Scraping works well in Prometheus, but there are a couple of drawbacks:
- Horizontal scaling can be tedious to implement.
- Some form of service discovery needs to be passed to Prometheus, so you can monitor your servers as they scale out and in.
Generally, though, scraping has more support than remote write and is better suited for servers where you don’t want (or can’t) install any additional applications on them. Prometheus also supports some forms of service discovery out of the box. For example, you can authenticate your server with EC2 and Prometheus can dynamically scrape all of your available instances.
If you’d like to use the scraping approach, here’s an example of what a scrape configuration looks like:
global:
  scrape_interval: 15s
  evaluation_interval: 15s

scrape_configs:
  - job_name: "prometheus"
    static_configs:
      - targets: [
        "localhost:9090",
        "192.168.1.11:9100"
        # additional endpoints...
      ]
As you can see, it’s a pretty straight-forward configuration.
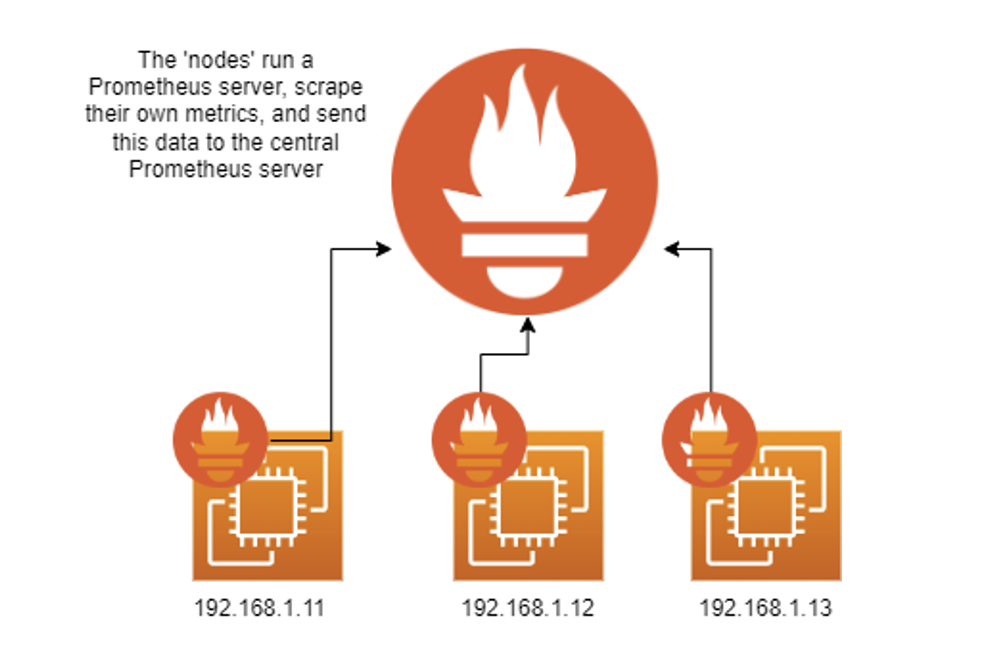
Remote Write
When I originally wrote this article, remote write was the only mode supported by Amazon Prometheus, but now it supports scraping as well.
Prometheus remote write mode allows you to send metrics directly to a Prometheus server. The server has to be configured to use remote write first. Remote write is used for a couple of use-cases:
- Agent-mode Prometheus deployments – for example, monitoring Linux servers without exposing HTTP endpoints.
- Open Telemetry – for example, using the Prometheus Open Telemetry exporter, to write metrics directly to a Prometheus server.
- Custom monitoring solutions – for example, if you want to monitor an API or something that doesn’t support Prometheus, you can write a custom exporter that will build a custom payload that adheres to the Prometheus remote write standard and can write to a remote Prometheus Server
As you’d expect, there are a few drawbacks to using remote write mode as well, and they are:
- Remote write is typically less supported than scraping, for example, I don’t believe the Windows exporter supports remote write just yet.
- Your client server will need to be authenticated with the remote Prometheus server. Ideally, you want some form of complex authentication such as IAM, requiring SigV4 authentication.
Using remote write can simplify your Prometheus deployment in other ways, though. Firstly, you don’t need to implement service discovery for Prometheus, and secondly, you don’t have to configure your servers to expose an HTTP endpoint.
Let’s take a look at an example of a remote write configuration.
global:
  scrape_interval: 15s
  evaluation_interval: 15s

# we still want the local prometheus server metrics
scrape_configs:
  - job_name: "prometheus"
    static_configs:
      - targets: [
        "localhost:9090",
        "localhost:9100"
      ]

remote_write:
  - url: # our URL
    sigv4:
      region: ap-southeast-2
    queue_config:
      capacity: 2500
      max_shards: 200
      min_shards: 1
      max_samples_per_send: 1000
The above configuration will configure a local Prometheus server to send it’s metrics to Amazon Managed Prometheus.
Open Source vs AWS Prometheus
We’ve just covered what Prometheus is and how to configure it, let’s go over the differences between the open-source version of Prometheus and the AWS version. There’s not many.
| Difference | Amazon Managed Prometheus | Open Source Prometheus |
| Hosting | Hosted by AWS | Hosted by you, could be in AWS or on-premises |
| Retention Period | Deleted after 150-days | Configurable by you |
| Authentication | AWS IAM (Sigv4) | Configurable by you |
| Data Storage | Abstracted, you have no control over it | Configurable data store |
| Alert Manager | Yes | Yes |
| Modes Supported | Remote write and scraping | Remote write and scraping |
As you can see, there’s no really a whole lot of differences. Personally, I think the benefits of having Prometheus managed by AWS outweigh the extra control you have with the self-hosted version. Remember, that it is possible to use both open source and managed Prometheus together.
Setting up an AMP Workspace
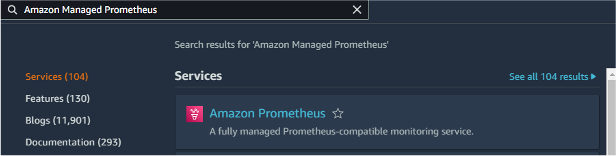
1. Navigate to the Amazon Prometheus Service in the AWS Console
2. Click ‘create’
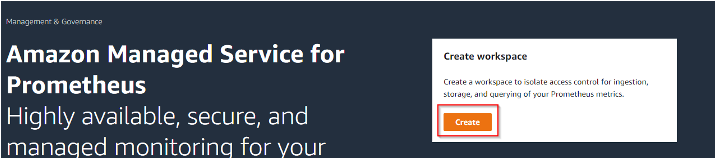
3. Enter your workspace alias and any tags
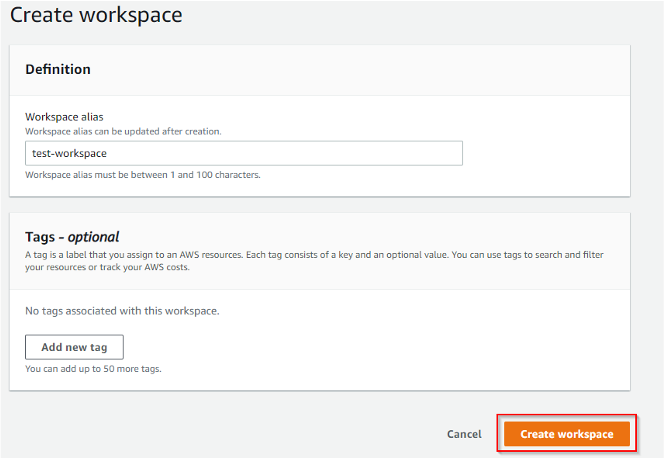
4. Click ‘create workspace’
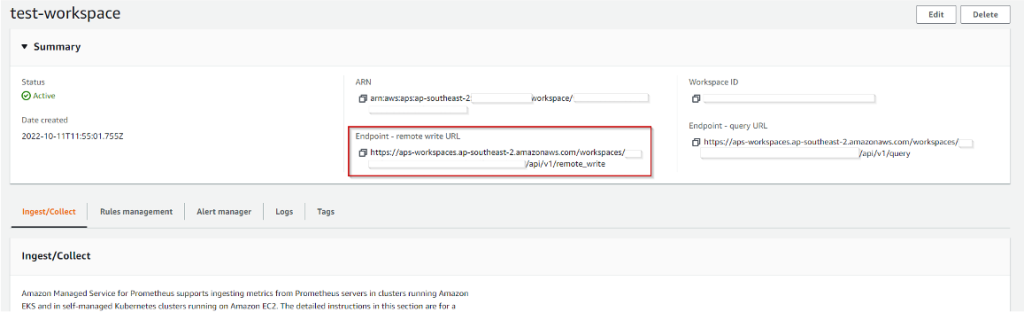
That’s all you need, you’ve setup your workspace, now you can start ingesting data.
Configuration Patterns
There are a few possible usage patterns you can utilise with Amazon Prometheus. We’ll discuss:
- Writing directly to AMP in agent mode
- Remote writing from Prometheus
- Writing directly into AMP using Lambda (best of both worlds)
Write directly to AMP in agent mode
The simplest way to utilise AMP is to write directly to it. The benefits of course are simplicity and security, although as I raised earlier, remote write is still gaining support.
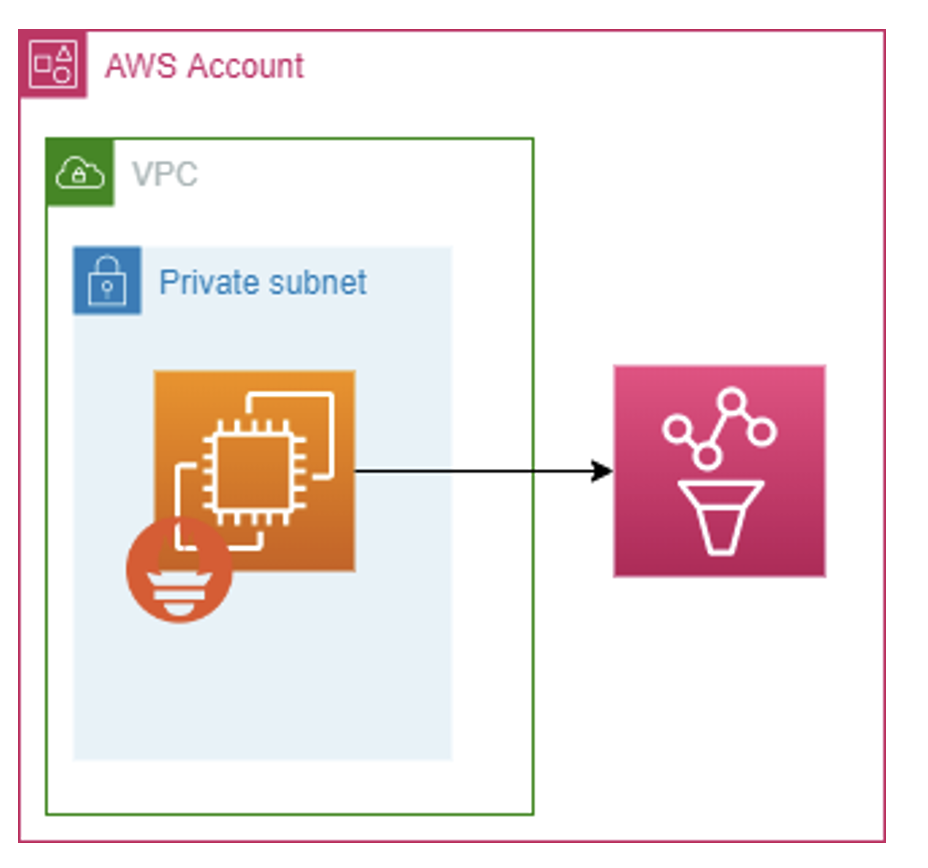
It’s important to know the AWS services that work well with AMP out of the box such as EKS. So, you might use AMP in this configuration with EKS as well.
Remote write from Prometheus
If you have a specific workload that you need to scrape, you can set-up an intermediary Prometheus server to scrape data from your workload and then remote write it directly into Prometheus.
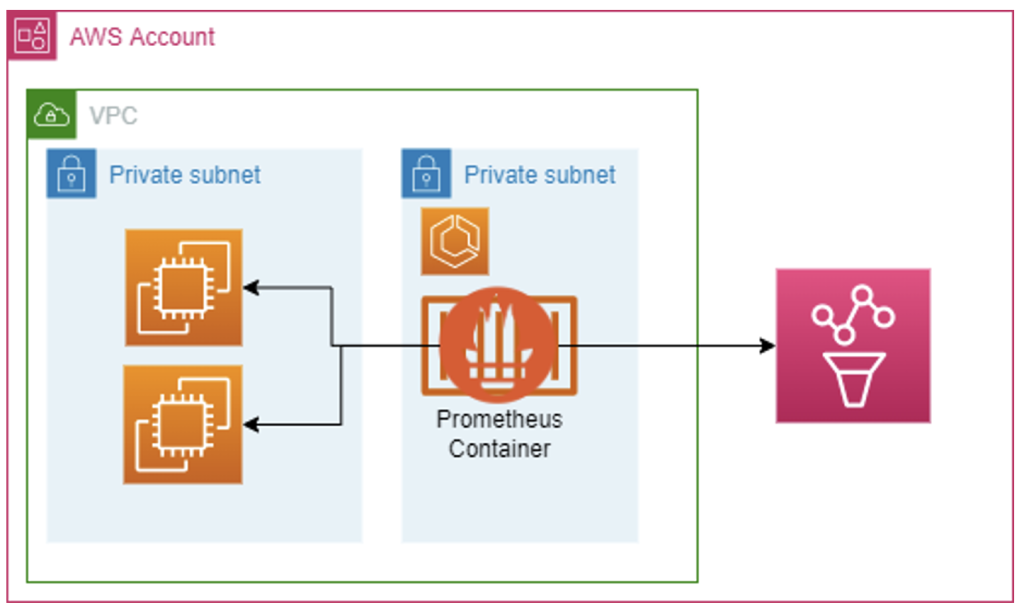
You might view this as a reason to ditch AMP and go with open source Prometheus, but AMP still has benefits here:
- You don’t have to worry about data retention in your intermediary Prometheus server, AMP still stores the data, your server just caches.
- Still a simpler deployment because you limit the use of open source Prometheus.
Writing directly into AMP using Lambda
If you have the time to invest, you can write Lambda functions to scrape APIs (including custom AWS scripts) and your workloads that still need to be scraped. Your lambda functions can then write this data directly into AMP using the remote write protocol.
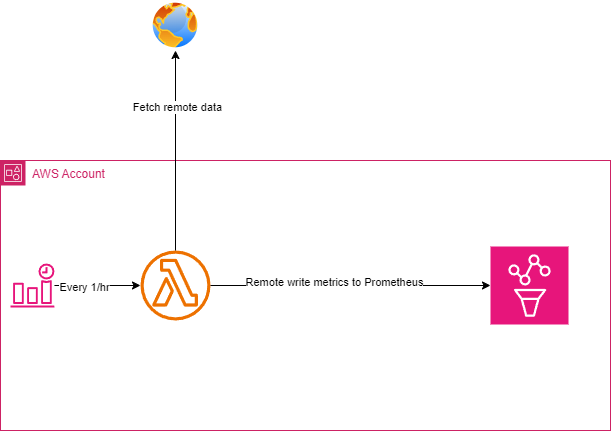
There are, of course, some obvious downsides of this approach:
- Writing the lambda can be complex, especially initially, there are some libraries that can help you (e.g. Open Telemetry Exporters) but generally, with Lambda, you’re own your own and might have to implement your own library.
I consider this, though, to be the best way to get maximum observability because there are many APIs that you might want to scrape and organise the data into meaningful metrics that you want to visualise. For example, you might want to write complex functions to calculate your spend with more depth that AWS provides out of the box, you can do that using lambda functions that write directly to Prometheus
Visualising Your Metrics in AWS Grafana
Since AMG and AMP are both AWS services, they integrate nicely, making it easy to visualise your AMP metrics.
Simply add AMP as a data source by navigating to AWS > Datasources
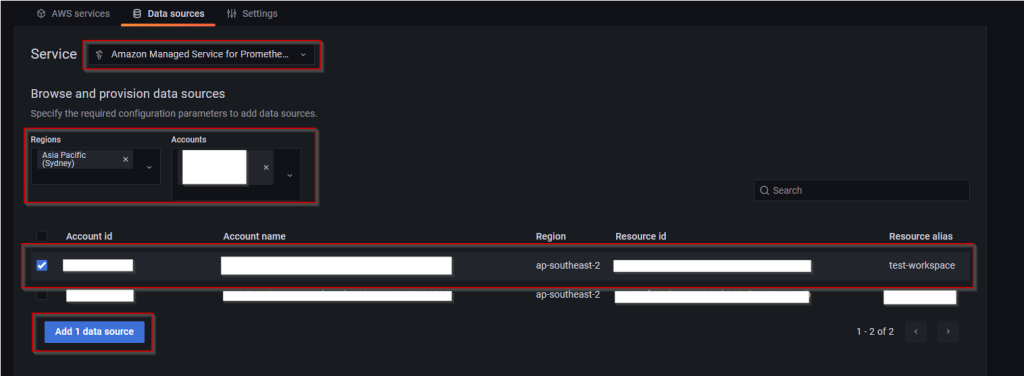
Provided you’ve configured Grafana with a role it can use to authenticate with AMP, then it will be able to access it seamlessly using Sigv4 authentication.
And that’s it! you can now visualise those metrics. Here are a couple of examples of dashboards I populated in my lab.
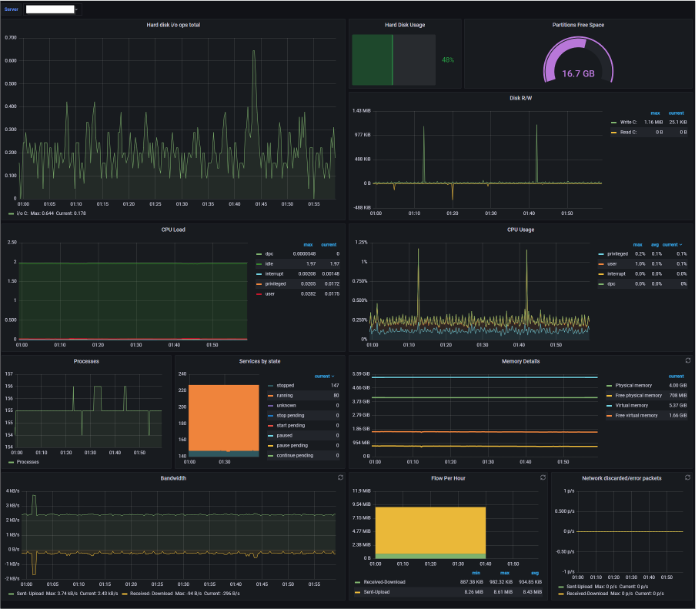
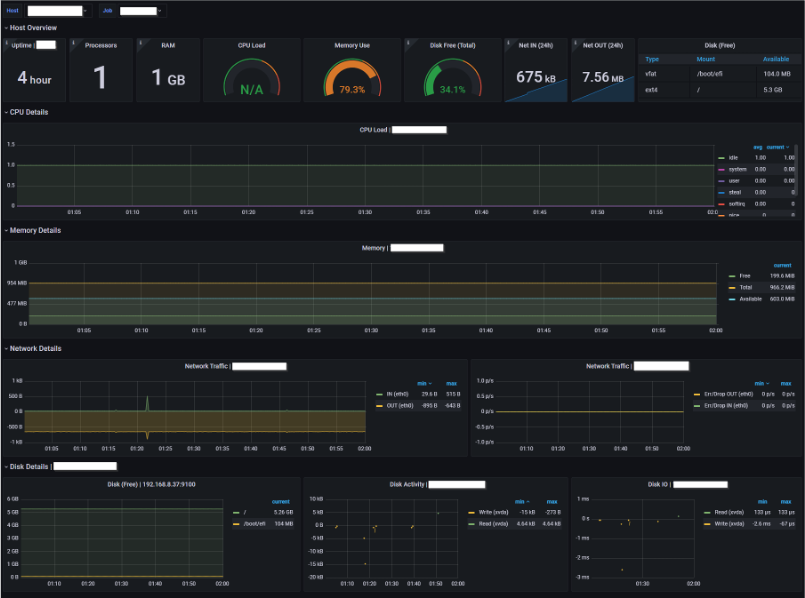
In the above example, we’ve got Windows metrics on the left and Linux metrics on the right. Super easy!
Closing notes
I hope this helped you to set-up AMP in your environment. It’s not comprehensive but should have given you a brief overview of how you can use AMP to achieve some pretty meaningful results, and at least given you something to think about in your next rearchitecture.
Leave a Reply